Golfer mid-swing on a sunlit fairway, late afternoon golden light
Golf Instruction · Biomechanical Analysis

147 students. Average handicapreduction: 7.3 strokes.

Biomechanical swing coaching for executives, juniors, and club teams. Every lesson is built on data — launch monitor, slow-motion capture, and a diagnostic framework honed over twelve years on the lesson tee.

Scroll
Credentials & Certifications
PGA

PGA of Australia

Class A Member

Full professional membership since 2012

TPI

Titleist Performance

Certified Level 3

Biomechanics & physical screening specialist

SAM

SAM PuttLab

Certified Fitter

Putting stroke analysis & custom fitting

TM

TrackMan

University Certified

Advanced launch monitor diagnostics

GSA

Golf Australia

Accredited Coach

National coaching pathway Level 3

K-VEST

K-VEST 3D

Certified Instructor

Kinematic sequencing & body motion analysis

Case Studies

Three students. Three different games. One coaching framework.

CS-001Executive Player
2026-02

From 12 to 4: How a persistent over-the-top move was costing Marcus eight shots a round

Marcus Delahunty·CFO · 12 handicap · Sydney

Marcus arrived with a swing built around compensation. Fifteen years of weekend golf had layered fix upon fix — a strong grip to mask an early release, a wide stance to stabilise a lateral slide, a deliberate pause at the top to prevent casting. Launch monitor data told the real story: 8.4° out-to-in club path, 14° open face at impact, 38-yard average dispersion off the tee.

Diagnostic Findings

  • TrackMan session: 8.4° out-to-in path, 3,100 rpm spin average
  • K-VEST analysis identified early upper-body rotation (X-factor loss at P5)
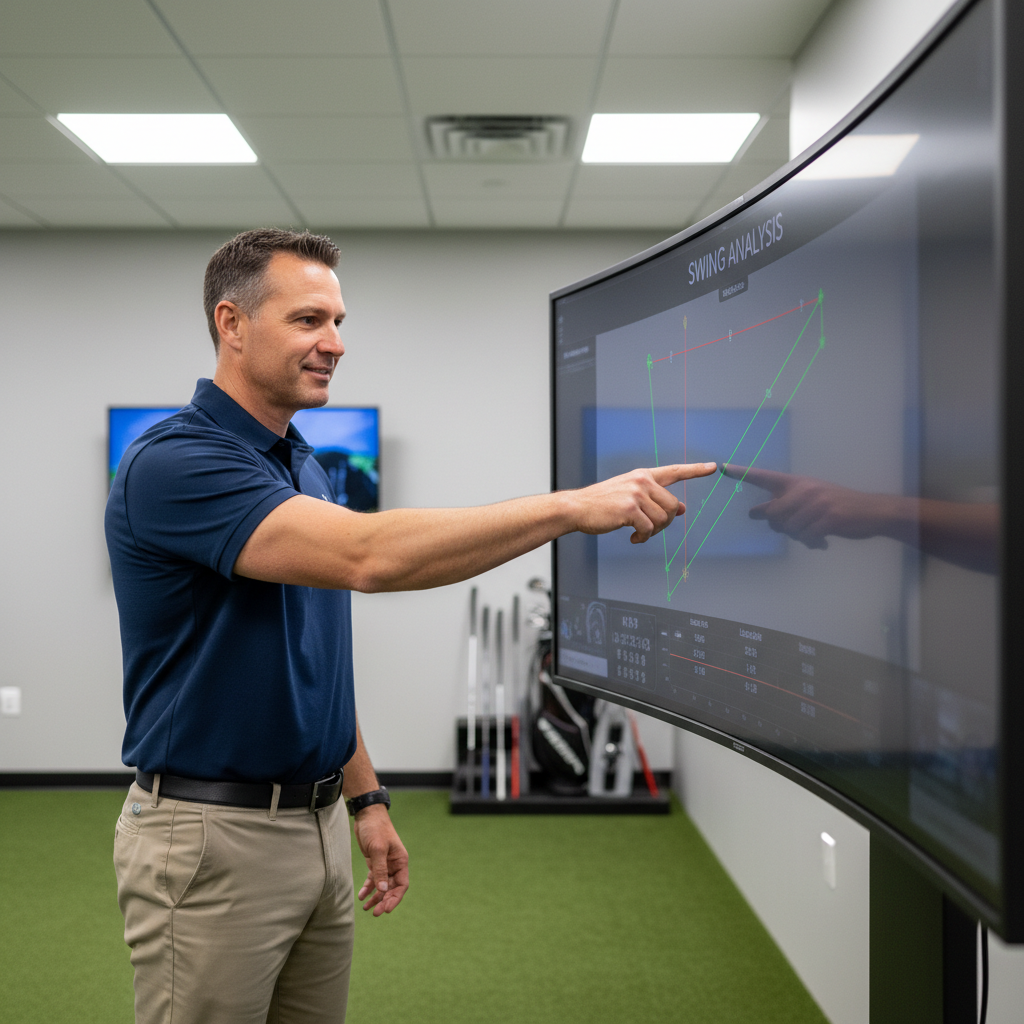
  • Slow-motion capture: club crossing the line by 22° at P4

"I stopped trying to fix symptoms. James identified the root cause in the first session. The rest was repetition."

Executive golfer at the top of his backswing on a well-maintained fairway

Measured Result

12.4 HCP

Before

4.1 HCP

After

+31 yards driving distance · GIR improved 34% → 61% · 8.3-stroke reduction in 14 months

CS-002Junior Competitor
2026-02

Rebuilding Priya's short game under pressure: eliminating the yips before State Championships

Priya Nair·U18 State Squad · 3 handicap · Melbourne

Priya's parents drove 90 minutes each way. The problem wasn't her full swing — it was a putting stroke that had collapsed under competition pressure. SAM PuttLab data revealed 7.8° face rotation through impact, a deceleration pattern, and inconsistent strike location. In the two months before State Championships, she had three-putted 41% of greens.

Diagnostic Findings

  • SAM PuttLab: 7.8° face rotation, 14mm off-centre strike average
  • Pressure testing under simulated tournament conditions
  • Video review of 60+ competition putts identifying trigger points

"She had the talent. She needed a system she could trust when the nerves hit. That's what James built."

— Meena Nair, Priya's mother

Young female golfer lining up a putt on a competition green

Measured Result

41% three-putt rate

Before

9% three-putt rate

After

Finished T4 State Championships · Handicap reduced 3.0 → 1.2 · Selected for National Development Squad

CS-003Club Team
2026-02

A club team drops 2.1 strokes per player in eight weeks. They win their first pennant in eleven years.

Ryde Golf Club — A-Grade Pennant Team·12-player squad · Western Suburbs Competition

The Ryde A-Grade captain approached with a collective problem: a squad averaging 8.4 handicap that consistently underperformed in team formats. Individual brilliance evaporated under pennant pressure. Analysis of twelve months of competition scorecards identified a pattern — the team played 1.8 strokes above handicap in away matches and lost 67% of matches decided on the 18th.

Diagnostic Findings

  • Scorecard analysis: 1.8 over handicap in away matches vs 0.3 in home matches
  • Group TrackMan session identifying consistent fault patterns across the squad
  • Mental game audit: 9 of 12 players identified as "reactive" under pressure

"James didn't just fix swings. He changed how this team thinks about pressure golf. The pennant was the proof."

— Daniel Kowalski, Club Captain

Group of golfers celebrating on the 18th green after a team victory

Measured Result

8.4 avg HCP · 33% win rate

Before

6.3 avg HCP · 78% win rate

After

First pennant title since 2015 · Squad average 2.1-stroke improvement · Zero retirements in final six matches

Book Your Assessment

Every lesson starts with the same question:
what's actually causing this?

The Swing Assessment is a 90-minute diagnostic session. You'll leave with a written fault analysis, a prioritised drill sequence, and a clear picture of the fastest path to your target handicap. No guesswork. No generic tips.

TrackMan Ball Flight Analysis

Every relevant number — path, face, attack angle, spin rate, carry

Slow-Motion Video Capture

Frame-by-frame review at key positions P1 through P10

K-VEST Kinematic Sequencing

Body motion analysis revealing sequencing faults invisible to the naked eye

Written Fault Report

Prioritised findings you keep — the root cause and the fix hierarchy

Confirmation within one business day · No payment required to book

The Diagnostic Method

What happens in the first 90 minutes.

The lesson bay smells of rubber mats and fresh grip tape. The TrackMan is already running. Every session follows the same four-stage diagnostic framework — because guessing costs strokes, and data doesn't lie.

01

Ball Flight Diagnosis

TrackMan 4

Every session opens on the launch monitor. Club path, face angle, attack angle, dynamic loft, spin rate, carry distance — the numbers tell us what the eye misses. We build the diagnostic picture from data before we form a single opinion.

14 data points per shot

02

Slow-Motion Capture

High-Speed Video

Face-on and down-the-line footage at 240fps. Each swing is reviewed against the ten key positions — from address through P10 — with annotated overlays showing club face, path, and body position at every critical moment.

240fps · P1–P10 analysis

03

Kinematic Sequencing

K-VEST 3D

The K-VEST sensors measure the sequence and timing of how your body segments rotate. Tour players fire in a precise sequence — pelvis, thorax, lead arm, club. Deviations from this sequence are often the root cause behind ball flight faults that look like swing problems.

3D body motion · millisecond timing

04

Fault Prioritisation

Written Report

Most golfers have three to five faults operating simultaneously. Fixing them in the wrong order creates new problems. The written report ranks faults by impact and prescribes a drill sequence — so you practice the right things in the right order, every session.

Prioritised drill sequence

Golf instructor reviewing launch monitor data on a tablet in a modern lesson bay

TrackMan Session

Path: 8.4° out-to-in · Face: +14° open · Spin: 3,100 rpm

Golf coach pointing at swing analysis overlay on a large screen monitor
Slow-motion analysis · 240fps

SwingPro · Framework Guide

The 7-Stroke Framework

The seven biomechanical positions that account for 80% of handicap reduction — and the diagnostic questions that reveal which ones you're getting wrong.

01Address & Setup Fundamentals
02Backswing Plane & Width
03Transition Sequencing
04Impact Zone Mechanics
05Short Game Fundamentals
06Putting Stroke Analysis
07Course Management Principles

14 pages · Drill sequences included · PDF download

Free Resource

Not ready to book? Start here.

The 7-Stroke Framework is the diagnostic guide I use in every initial assessment. It maps the seven positions that determine 80% of your ball flight — and gives you the questions to ask about your own swing before you ever step on a lesson tee.

No spam. Unsubscribe anytime. Your email is never shared.